UGC.nl – #69183b9915bbdc6f2e47fc59
Test Details
Test Overview
We know your ultimate goal is to generate sales and achieve a low Cost Per Acquisition (CPA). However, CPA depends on many factors like your landing page, budget, and targeting.
BrandPulse focuses purely on the Creative Variable.
We measure actual audience behavior. We look at Stopping Power (do they stop scrolling?) and Attention Holding (do they keep watching?). If a video has high retention, social media algorithms like TikTok and Meta will prioritize it. This typically leads to lower advertising costs for you. This analysis combines real human data from our panel with AI behavioral insights.
This test evaluated six Sinterklaas-themed video concepts.
The Verdict: Video 1 is the clear winner. It achieved a perfect score of 95 across all metrics. It grabs attention immediately and keeps viewers watching. It performs significantly better than the average benchmark.
Type
Video
Test period
7 days
Completion date
November 26, 2025
Test Assets

Video 1
Video 2
Video 3

Video 4
Video 5
Video 6
Location Targeting
Languages
Demographics
Male, Female, Other
Intent Signals
Passion Profiles
Life Milestones
Package Details
Silver
Performance Overview
Best Performing Asset
Human Audience Signals
VS 30.000 bought audience signals
Confidence Level
VS 80% bought confidence level
Demographic Distribution
Gender Distribution
Age Distribution
Asset Performance
Asset |
SPR
The Stopping Power Rating (SPR) indicates how effectively a video captures initial attention in the very first moments. A higher SPR means the asset is more successful at triggering an immediate stop.
|
AHR
The Attention Hold Rating (AHR) shows how long viewers continue watching once their attention has been captured. A higher AHR reflects stronger ability to maintain interest throughout the viewing moment.
|
QER
The Qualitative Engagement Rating (QER) represents the level of interaction viewers have with the video based on engagement behaviour. A higher QER indicates that viewers are engaging more actively with the asset.
|
Audience Signals |
|---|---|---|---|---|
|
Video 1
|
6050 |
|||
|
Video 5
|
5175 |
|||
|
Video 2
|
5387 |
|||
|
Video 6
|
6.261 |
|||
|
Video 3
|
6636 |
|||
|
Video 4
|
5513 |
Detailed Asset Analysis
In-Depth Visual Analysis
Each asset has been analyzed using our proprietary AI-powered Visual Heatmap Technology , which identifies areas of high visual engagement and attention. The heatmaps reveal how users interact with different elements of each image, highlighting focal points and areas that drive engagement. This data-driven approach allows us to understand why certain visuals perform better than others and provides actionable insights for optimizing your visual assets.
View all assets
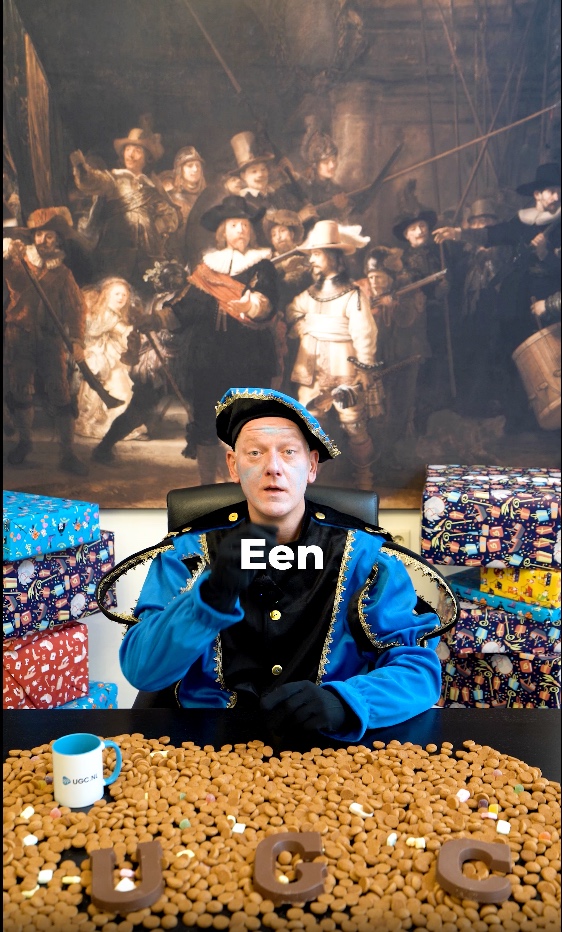
Video 1
AI Insights
Powered by AI
Why it works:
-
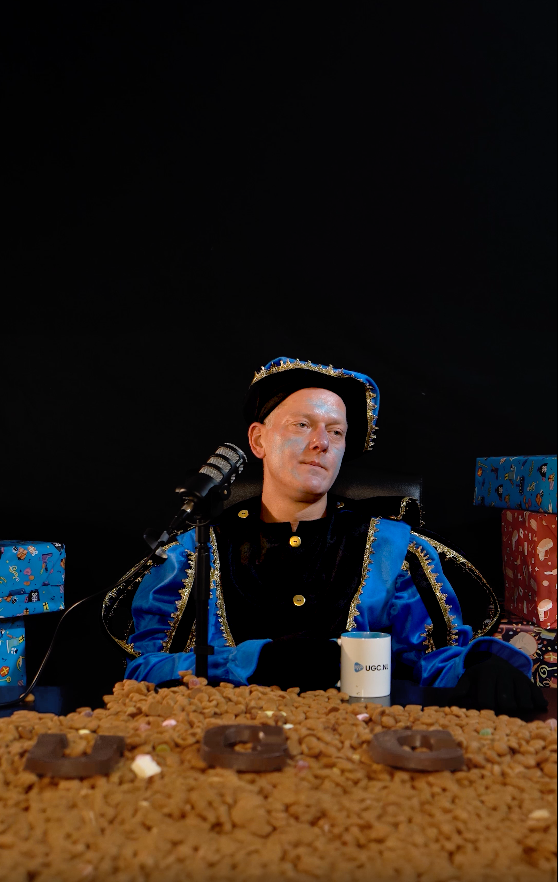
The Hook (High Contrast): This video masters Visual Salience. The bright blue costume and colorful presents pop out sharply against the deep black background. This high contrast focuses the eye immediately on the subject and eliminates distractions.
-
Why they stay (Gaze Cueing): The actor maintains unwavering eye contact with the camera lens. In behavioral science, direct eye contact signals intent and importance. This creates a “parasocial bond” that keeps the viewer locked in.
-
The Format: The “Podcast” set design with the visible microphone signals high-value entertainment. This bypasses the viewer’s mental “ad-blocker” because it looks like content they want to see.
-
SPR Score 95
-
AHR Score 95
-
QER Score 95
-
Probability to be Best 99.5%
-
Audience Signals 6050
-
Completion Rate 0.86%
Video Retention
Video 2
AI Insights
Powered by AI
Why it works (and why it fails): The video stops the scroll reasonably well because the text “UGC Video” is clear. However, the actor then starts using a whiteboard. A whiteboard reminds people of school or work meetings. It feels like a lecture. People come to social media for entertainment, not a lesson. This causes them to lose interest and leave.
-
SPR Score 41
-
AHR Score 24
-
QER Score 26
-
Probability to be Best 0.1%
-
Audience Signals 5387
-
Completion Rate 1.03%
Video Retention
Video 3
AI Insights
Powered by AI
Why it works:
-
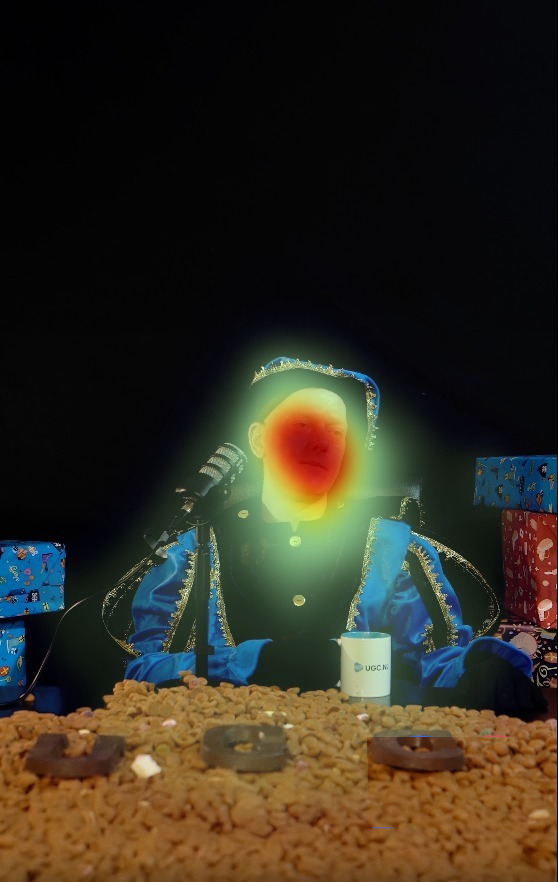
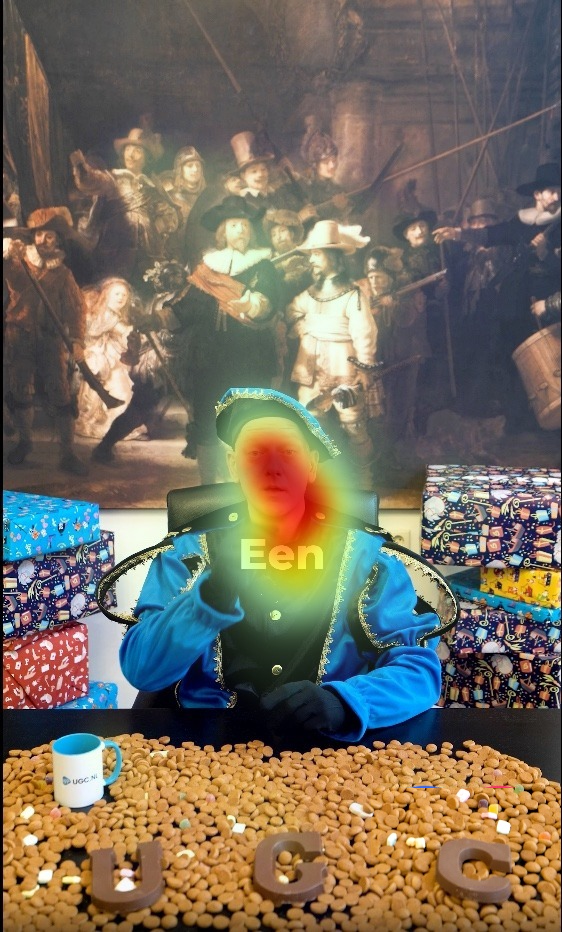
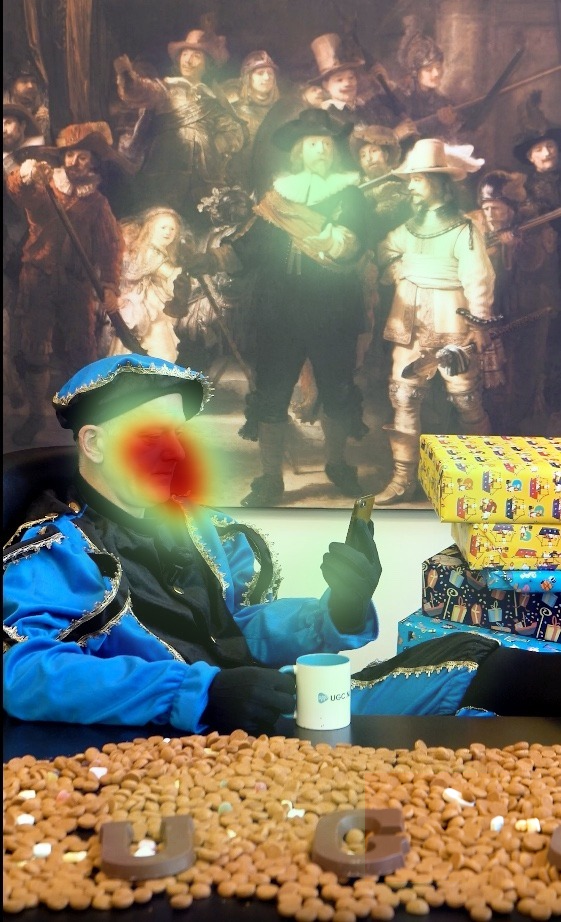
The Issue: The actor looks down at his phone at the start. On social media, if the person is passive, the viewer becomes passive and scrolls away. This explains the low stopping power.
-
The Win: The engagement score is very high (87). This is because the script is funny for your specific target audience. The joke about an influencer asking for “matcha tea” is very relatable for marketing managers. The people who did stop felt deeply understood by your brand.
-
SPR Score 19
-
AHR Score 38
-
QER Score 87
-
Probability to be Best 0.1%
-
Audience Signals 6636
-
Completion Rate 0.42%
Video Retention

Video 4
AI Insights
Powered by AI
Why it fails: The camera is too close to the face and the image is blurry. This confuses the brain. We call this a Disorientation Reflex. If the viewer cannot instantly understand what they are seeing, they feel uncomfortable. To stop this feeling, they swipe away immediately.
-
SPR Score 5
-
AHR Score 5
-
QER Score 5
-
Probability to be Best 0.1%
-
Audience Signals 5513
-
Completion Rate 0.84%
Video Retention
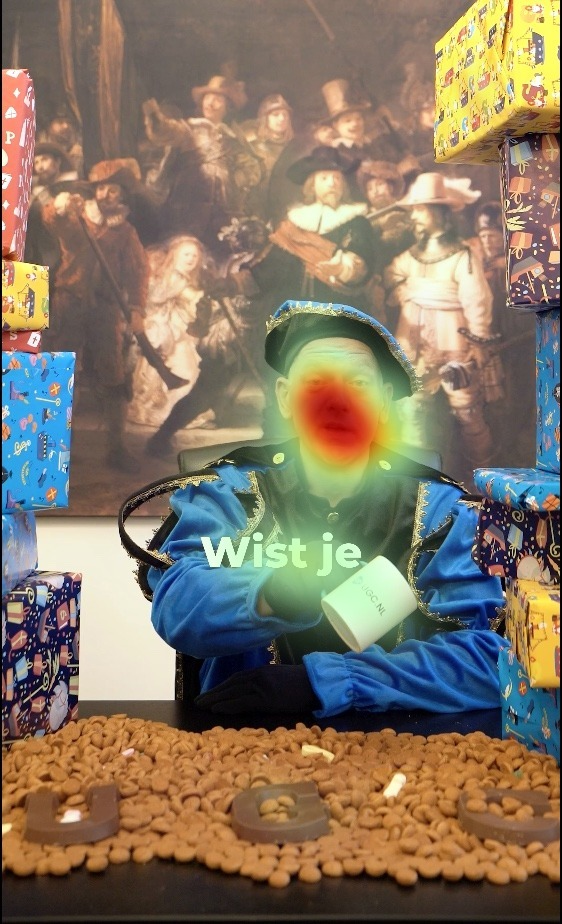
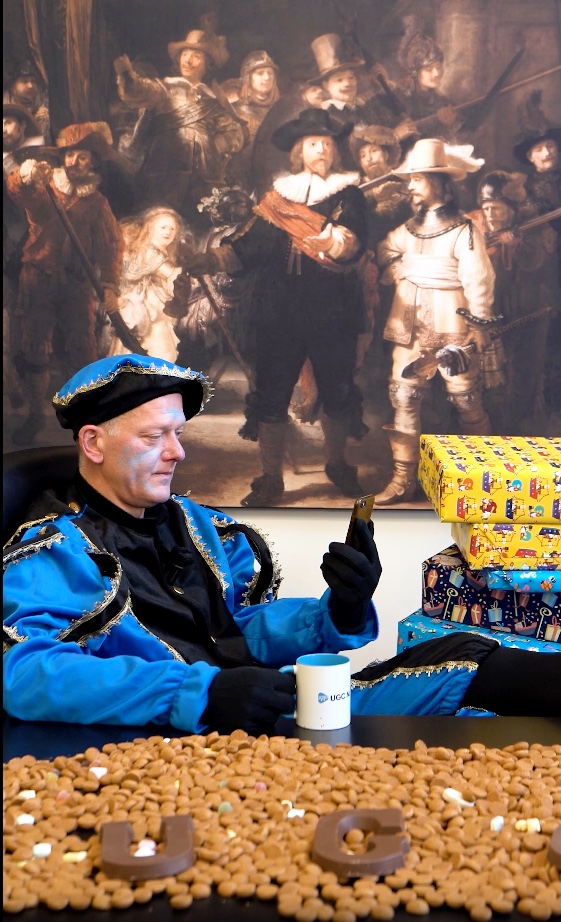
Video 5
AI Insights
Powered by AI
Why it works:
-
The Hook (Visual Tension): The video opens with the actor pouring coffee while looking at the camera. Liquid in motion creates tension because we are naturally afraid of spills. This grabs attention.
-
The Hold (Conceptual Metaphor): He uses different box sizes to explain the value. The huge box (present) represents the expensive agency and the tiny box (present) represents the cheap UGC price. This makes the savings easy to understand without needing sound. Viewers keep watching because they want to see him finish the process of sorting the boxes (presents).
-
SPR Score 46
-
AHR Score 62
-
QER Score 54
-
Probability to be Best 0.1%
-
Audience Signals 5175
-
Completion Rate 0.72%
Video Retention
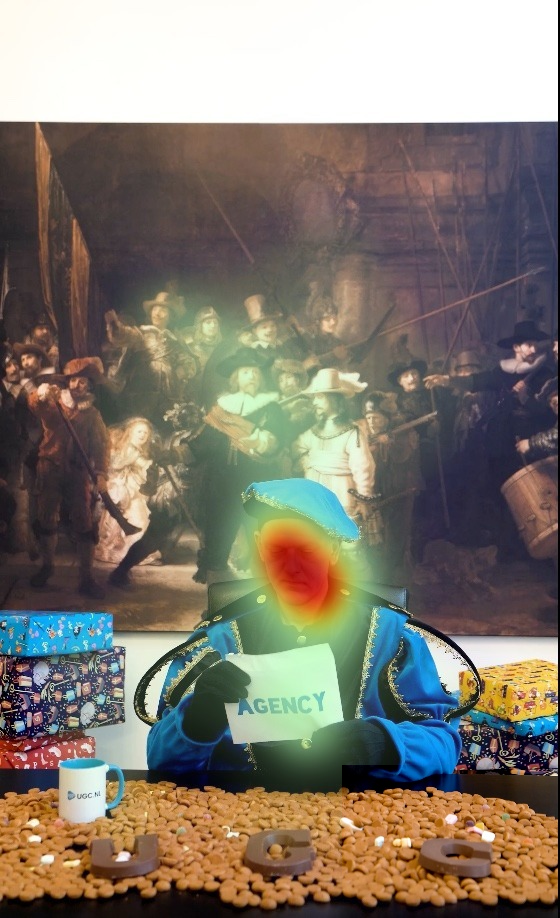
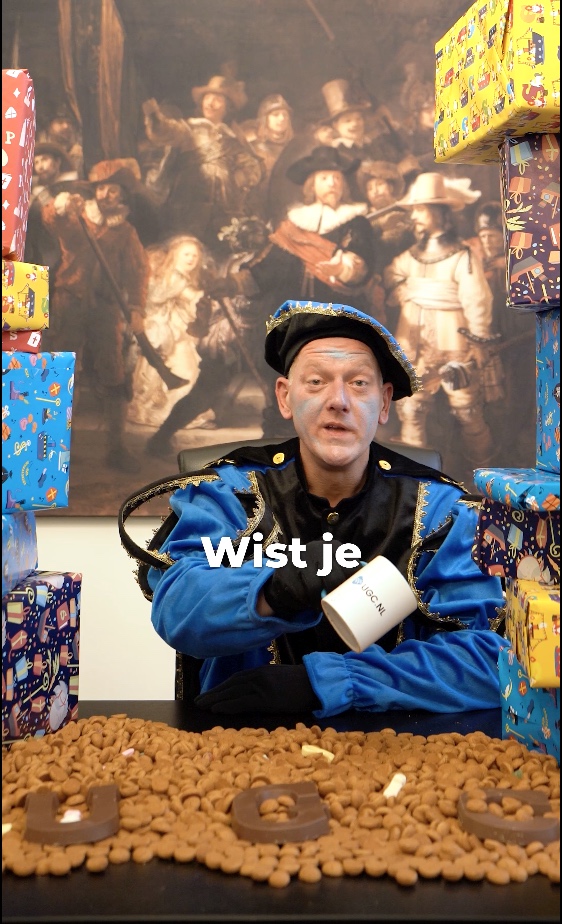
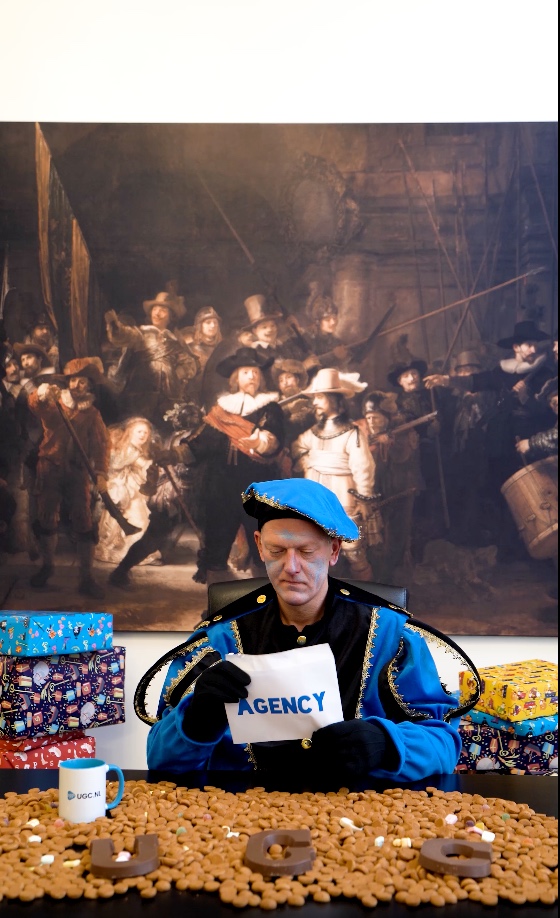
Video 6
AI Insights
Powered by AI
Why it works:
-
The Issue: The opening shot is static. The actor is just reading a paper. There is no urgency so people scroll past.
-
The Win: The video performs well in engagement because of the action that follows. The actor rips up the expensive bill. For business owners, seeing a high cost get destroyed feels good. It releases tension and creates a positive feeling.
-
SPR Score 22
-
AHR Score 33
-
QER Score 69
-
Probability to be Best 0.1%
-
Audience Signals 6.261
-
Completion Rate 0.96%
Video Retention
Statistical Analysis
Explanation of Tests
Chi-Square Test
Tests whether the differences in click behavior across all assets are statistically significant (based on SPR).
Result: Significant at 95% confidence (p = < 0.0001)
Z-Test
Compares the top two performing assets directly (based on SPR).
Result: Significant at 95% (p = < 0.0001)
Bayesian Test
Estimates the probability that each asset is truly the best (based on SPR).
Result: Video 1 almost has 100% probability
Statistical Significance Matrix
|
Asset |
95% Confidence Level Chi-Square Test |
95% Confidence Level Z-Test |
Bayesian Best Probability |
|---|---|---|---|
|
|
<0.0001 |
z = 11.98, p(one-sided) < 0.0001 |
99.5%
|
|
|
<0.0001 |
- |
0.1%
|
|
|
<0.0001 |
- |
0.1%
|
|
|
<0.0001 |
- |
0.1%
|
|
|
<0.0001 |
z = 11.98, p(one-sided) < 0.0001 |
0.1%
|
|
|
<0.0001 |
- |
0.1%
|
Key Insight: The Power of Human Connection
1. Eye Contact is Essential The data proves that looking at the camera is critical. Video 1 and Video 5 featured direct eye contact and achieved the highest stopping power. Video 3 and Video 6 featured the actor looking down and performed poorly in the first few seconds.
2. Physical Objects beat Explanations Video 5 showed the price difference using physical boxes (AHR 62). Video 2 explained the price difference using a whiteboard (AHR 24). The physical version kept attention much longer. Show, do not just tell.
3. Contrast Creates Focus Video 1 proved that a clean, high-contrast environment works best. The black background eliminated distractions and forced the eye to focus on the actor and the product. The busy backgrounds in the other videos (paintings, room details) created visual clutter that competed for attention.
Recommendations & Next Steps
Implement Winning Video
-
Scale Video 1: Put the majority of your media budget on Video 1. It is a proven winner. It creates the high retention signals that algorithms love.
-
Retarget with Video 3: Use Video 3 specifically for retargeting people who already know you. The “Insider Joke” will work very well to convert warm leads who understand the struggle of hiring influencers.
Guidelines for Future Videos:
-
The Hook: Always start with action or unwavering eye contact. Never start with someone looking down or reading.
-
The Setting: Use high-contrast sets (like the podcast studio). Avoid cluttered backgrounds or “lecture” tools like whiteboards.
-
The Format: Use physical props to explain concepts (like the boxes) rather than writing or talking.
Follow-Up Tests
To refine direction further:
-
Explore alternative characters or actors with the same tone and pacing
-
Test versions with enhanced motion or micro-cuts
-
Compare shorter vs. slightly extended edits
-
Test different target audiences for niche video’s
Based on the objective data from this test, Video 1 is the strongest creative asset. It should be the primary focus for your campaign rollout.
Its superior performance in Stopping Power and Attention Holding proves that it can compete in a crowded social feed. By prioritizing this high-retention asset, you provide the social media algorithms with the content they prefer. This maximizes your chances of achieving efficient reach and a lower Cost Per Acquisition.
This test has also provided clear “Do’s and Don’ts” for your future content. We now know that direct eye contact, high contrast, and physical storytelling work best for your brand.
Use these behavioral insights to optimize your media spend and to brief your creators for the next round of content.